Financial Spreadsheet: P&L + Cashflow, 30 km
This page translates an economic idea into a financial table: input parameters, annual revenues, operating expenses, net income, cash flow, and return on investment.
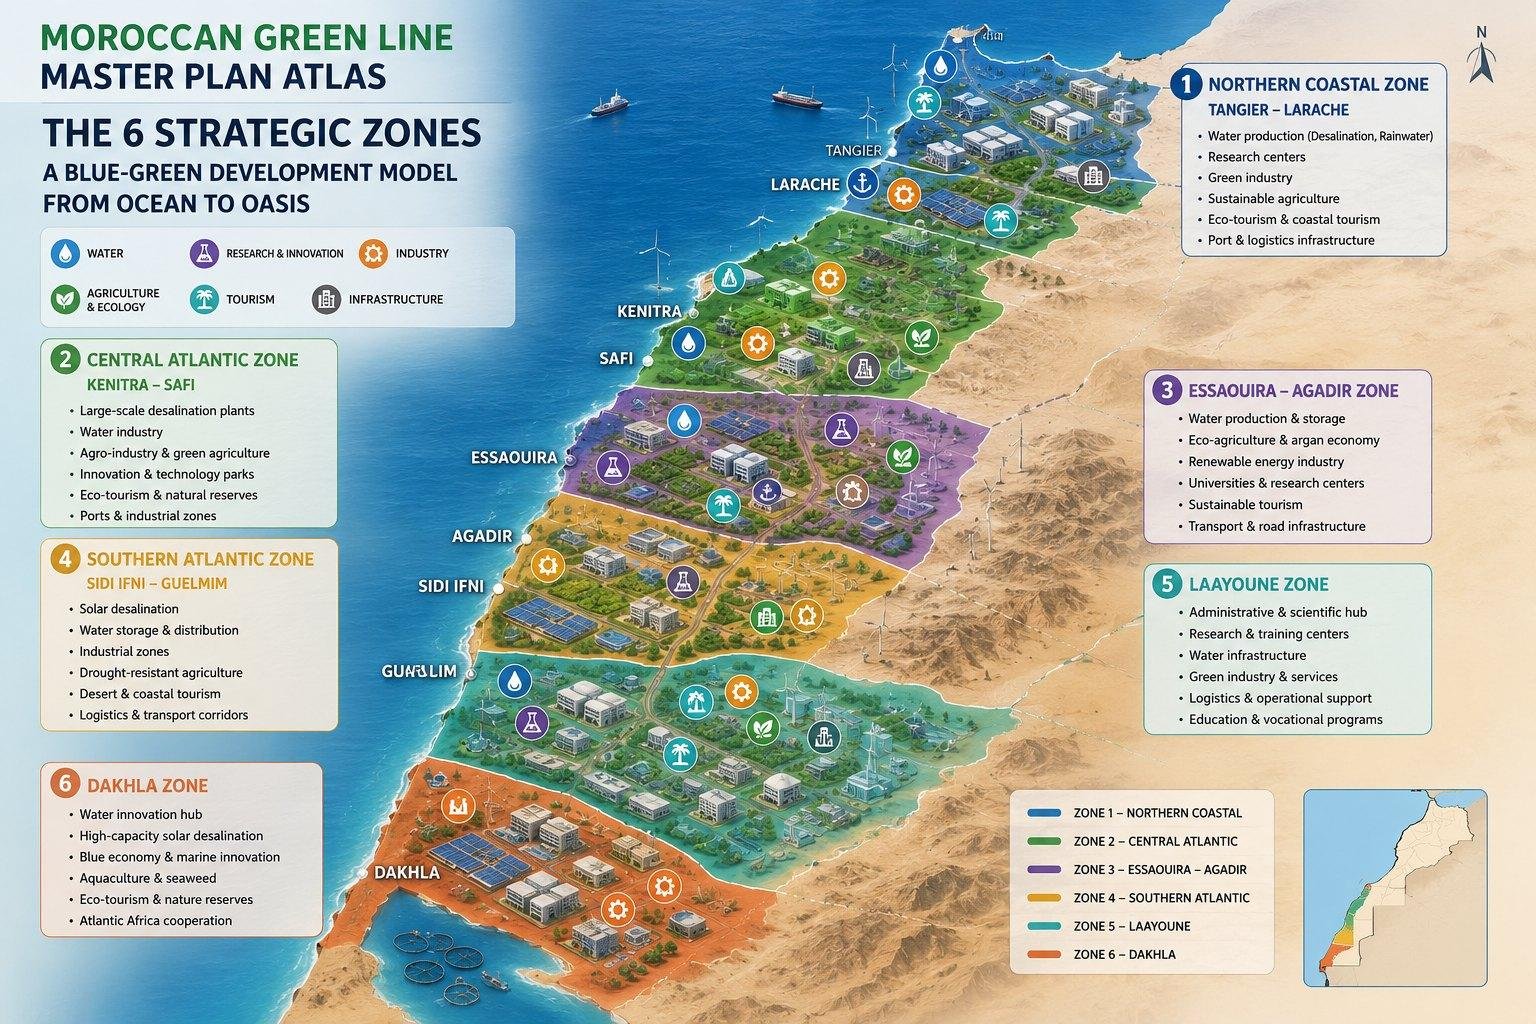
Input parameters
First, the scale, CAPEX and base OPEX are fixed
For financial control, it's important to see not only the final cost but also cash flow over the years. In the first two to three years, a project requires capital, but then multiple revenue streams are activated and the accumulated cash flow begins to recover.
| Parameter | Meaning |
|---|---|
| Length | 30 km |
| Active zone area | about 300 hectares |
| CAPEX | 2 700 000 € |
| OPEX start | 550,000 €/year |
Income by year
The table categorizes revenue by source. This allows you to see which blocks generate early cash flow and which begin to operate after the environment stabilizes.
| Year | Agricultural | Saplings | Seaweed | Carbon | Products | Grant | Total income |
|---|---|---|---|---|---|---|---|
| 1 | 0 | 50 000 | 0 | 0 | 0 | 200 000 | 250 000 |
| 2 | 0 | 150 000 | 50 000 | 0 | 0 | 150 000 | 350 000 |
| 3 | 200 000 | 200 000 | 100 000 | 100 000 | 0 | 0 | 600 000 |
| 4 | 400 000 | 300 000 | 150 000 | 200 000 | 150 000 | 0 | 1 200 000 |
| 5 | 600 000 | 300 000 | 200 000 | 300 000 | 300 000 | 0 | 1 700 000 |
| 6 | 800 000 | 200 000 | 250 000 | 400 000 | 500 000 | 0 | 2 150 000 |
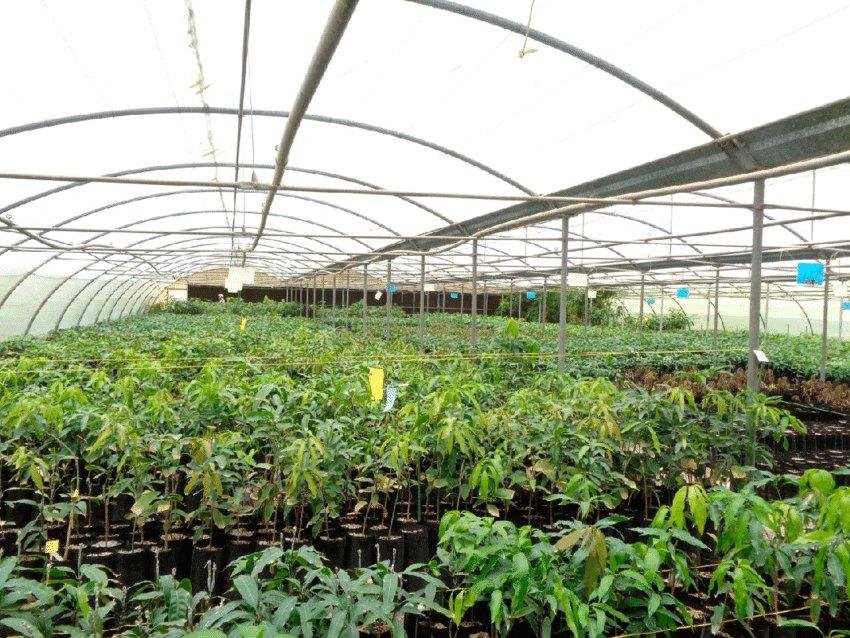
Saplings provide early income and reduce expansion costs.

The algae create a steady flow until the trees become productive.
Expenses: OPEX by year
Costs increase with the scale of service. The model gradually increases personnel, water, energy, maintenance, logistics, and materials.
| Year | Staff | Water / energy | Service | Logistics | Materials | Total OPEX |
|---|---|---|---|---|---|---|
| 1 | 250k | 100k | 80k | 70k | 50k | 550k |
| 2 | 260k | 100k | 80k | 70k | 50k | 560k |
| 3 | 270k | 110k | 90k | 80k | 60k | 610k |
| 4 | 280k | 120k | 100k | 90k | 70k | 660k |
| 5 | 300k | 130k | 110k | 100k | 80k | 720k |
| 6 | 320k | 140k | 120k | 110k | 90k | 780k |
Net profit
The operating result becomes positive later than the project's start. This is normal for the infrastructure model: the environment is built first, then it begins to produce economic benefits.
| Year | Income | Consumption | Profit |
|---|---|---|---|
| 1 | 250k | 550k | -300k |
| 2 | 350k | 560k | -210k |
| 3 | 600k | 610k | -10k |
| 4 | 1.2M | 660k | +540k |
| 5 | 1.7M | 720k | +980k |
| 6 | 2,15M | 780k | +1.37M |
Cashflow with investment considerations
Accumulated cash flow shows that operating profits emerge before the full payback of capital investments. Therefore, the project requires disciplined financing in the early years.
| Year | Investments | Profit | Cashflow | Accumulated cashflow |
|---|---|---|---|---|
| 0 | -2 700 000 | 0 | -2 700 000 | -2 700 000 |
| 1 | 0 | -300k | -300k | -3 000 000 |
| 2 | 0 | -210k | -210k | -3 210 000 |
| 3 | 0 | -10k | -10k | -3 220 000 |
| 4 | 0 | +540k | +540k | -2 680 000 |
| 5 | 0 | +980k | +980k | -1 700 000 |
| 6 | 0 | +1.37M | +1.37M | -330 000 |
According to this version of the table, full payback occurs around 6-7 years. The operational breakeven occurs earlier: approximately 3-4 years.
Key performance indicators
| Metrics | Meaning |
|---|---|
| Break-even operating | year 3-4 |
| Full payback | about 6-7 years |
| ROI year 6 | about 45-50% |
| EBITDA margin year 6 | about 60% |
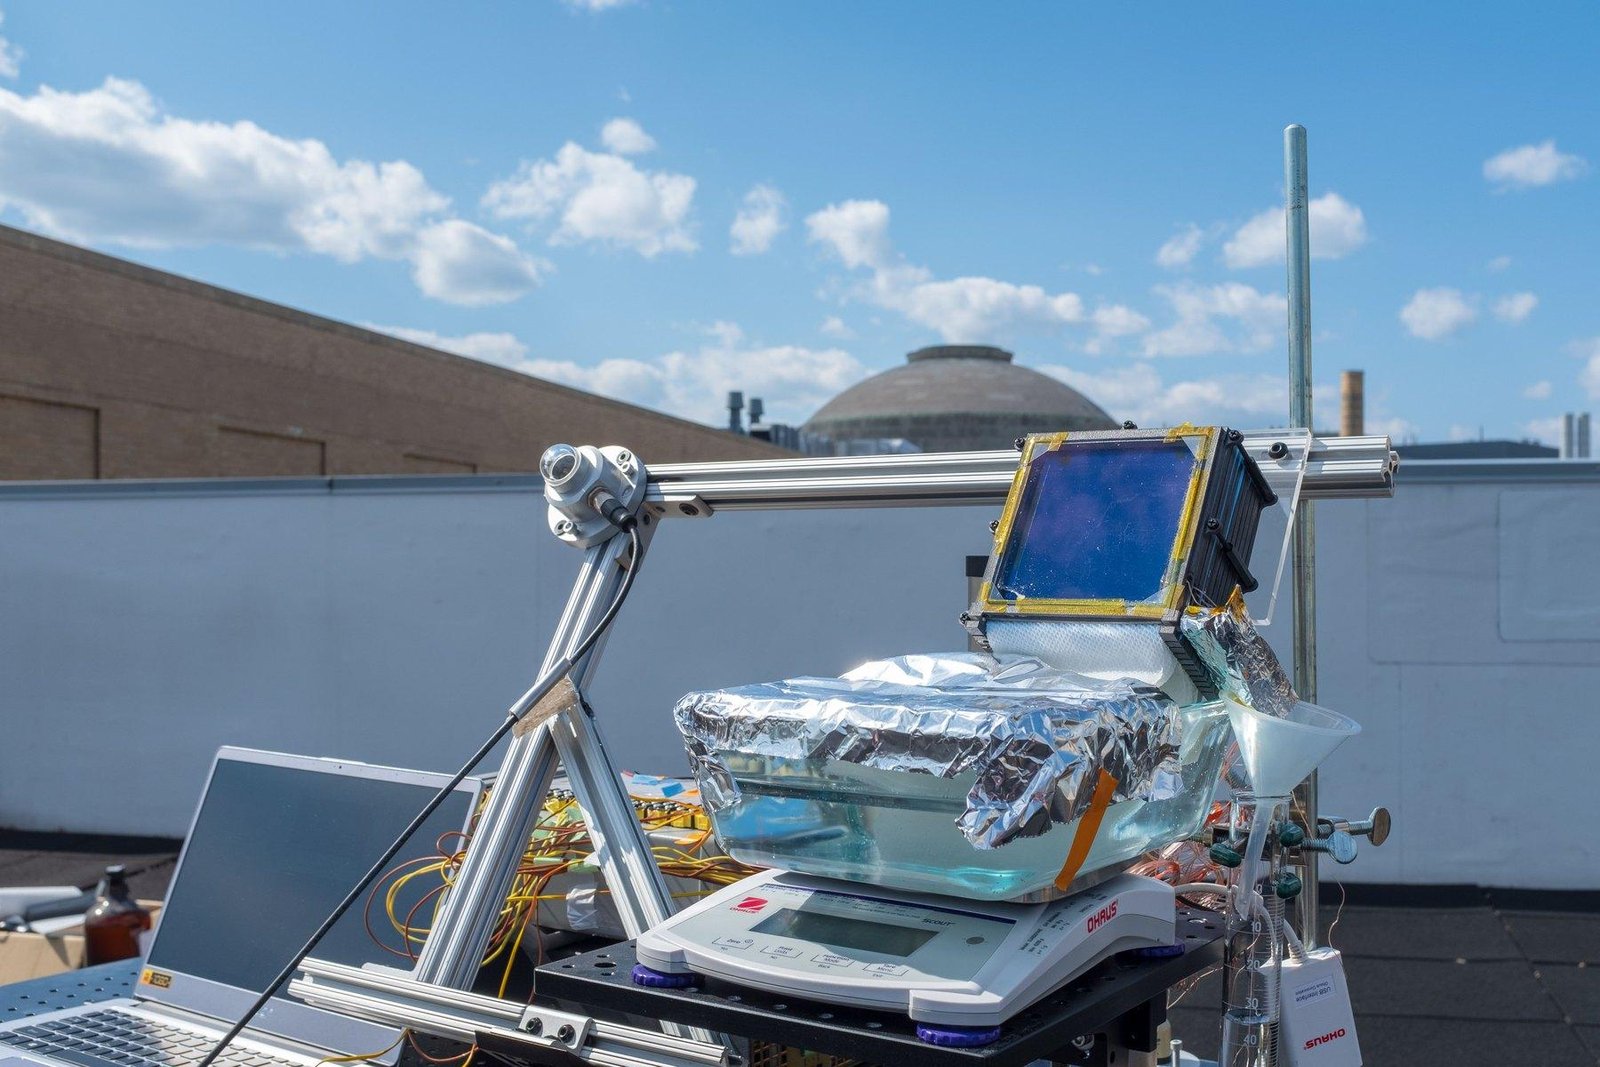
Water control directly impacts OPEX and cashflow stability.
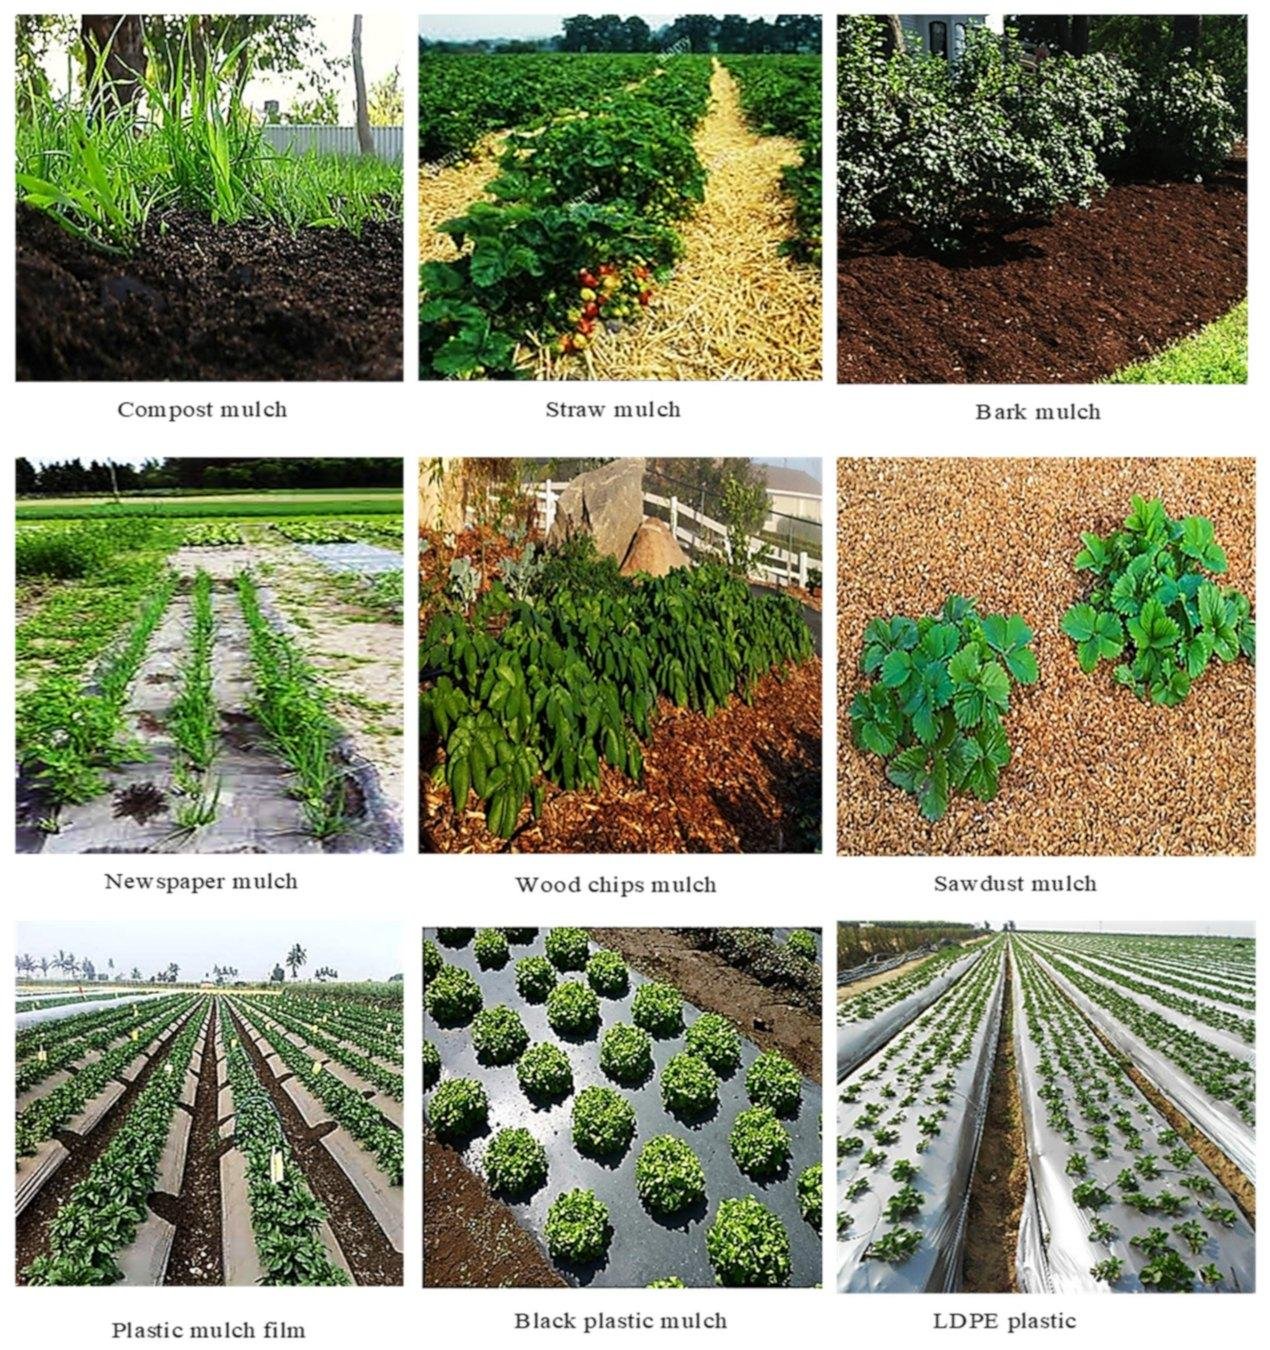
Soil and organic matter improve long-term productivity but require an early investment.
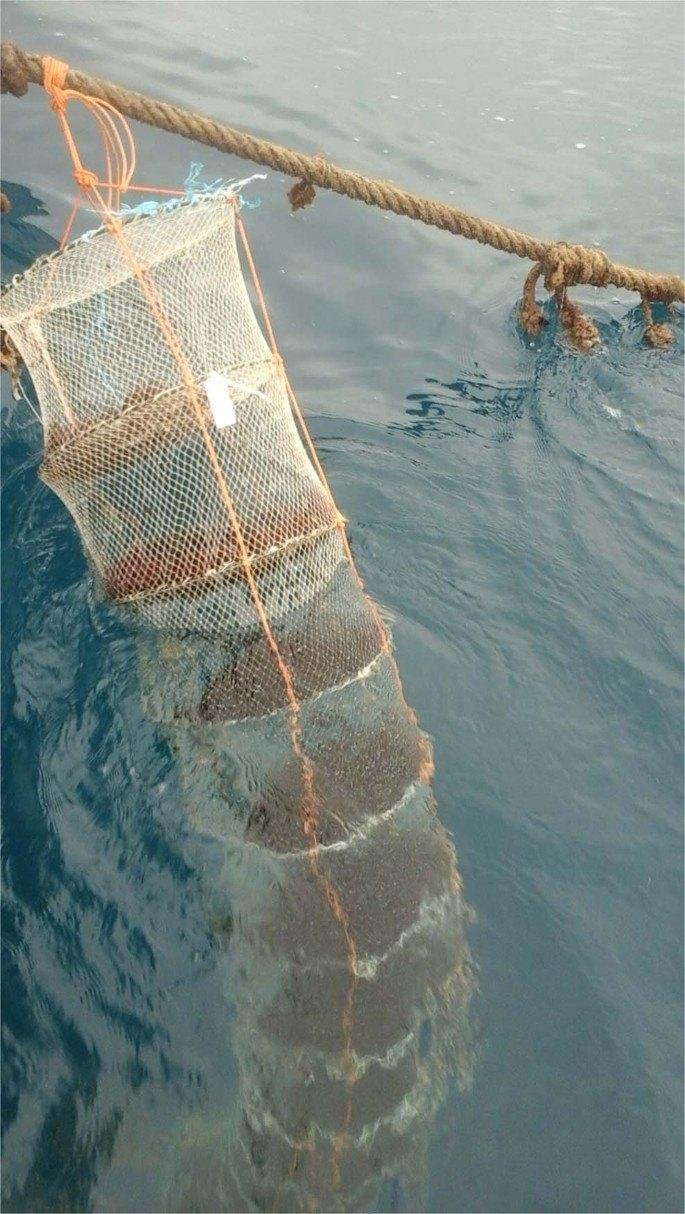
The algae block accelerates income and reduces dependence on the long tree cycle.
Simplified formula for conversion
| Part of the model | Formula |
|---|---|
| Income | (ha × income per ha) + algae + seedlings + carbon + products + grants |
| Consumption | people + water + logistics + maintenance + materials |
| Cashflow | operating profit - investment of the period |
| Accumulated cashflow | cash flow amount by year |
Conclusion
The model works, but it requires discipline: a proper start, water control, operational management, and sufficient capital for the first 2-3 years. The main drivers of profit are seedlings, carbon, algae, and long-term products.